1 - Introduction
This tutorial will show you how to use most of the available features. It is designed to give you step-by-step help. All the files mentioned in the examples are installed with the tutorial to allow you to follow the demonstration while performing the same analyzes and obtaining the same results as those appearing here.
It is also designed to allow you to start and stop easily where you want. If you want to learn more about specific tasks only, select the desired topics in the Content tab.
If you want detailed examples of statistical analysis methods, use Case Studies explained step-by-step.
2 - Sample files
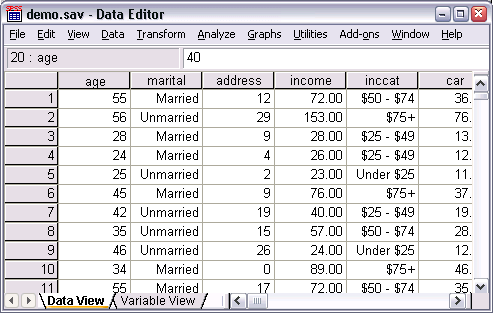
Most of the examples presented here use the demo.sav data file. This data file is a dummy survey of several thousand people, containing demographic and consumption information. See Sample Files for more information.
If you use the Student version, your version of the demo.sav file is a representative sample of the original data file, which has been collapsed to meet the 1,500 observations limit. The results obtained with this data file will be different from the results presented here.
3 - Opening a data file
To open a data file:
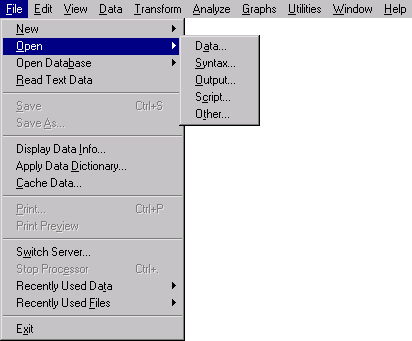
- From the menus, select:
File> Open> Data
4 - Execution Of an analysis
If you have add-ons, the Analysis menu contains a list of methods for analyzing reports and statistical analysis.
We will begin by creating a simple establishment plan. This example requires the Basic Statistics option.
5 - Displaying results
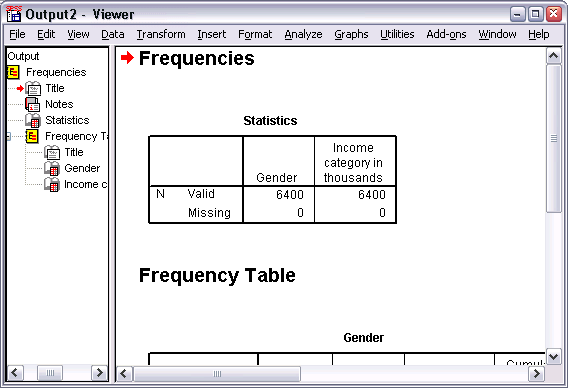
The results are displayed in the Viewer window.
You can quickly access any item in the Viewer by selecting it in the legend panel.
You can, for example,
- Click Income mode in thousands [rev_dis].
6 - Creating diagrams
Although some statistical procedures can create diagrams, you can also use the Graphs menu to create diagrams.
For example, you can create a diagram showing the relationship between the use of wireless telephony services and the ownership of an electronic organizer.


