Exercise 151
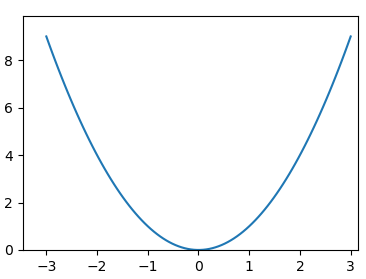
By using the matplotlib module, write a python algorithm which draw the curve of function f(x) = x2 on the interval [-3 , +3]
Solution
import matplotlib.pyplot as plt
import numpy as np
x = np.linspace(-3, 3, 100)
y = x**2
plt.plot(x,y)
plt.show()
...
Younes Derfoufi
my-courses.net
my-courses.net